Execution Tree
Execution Tree
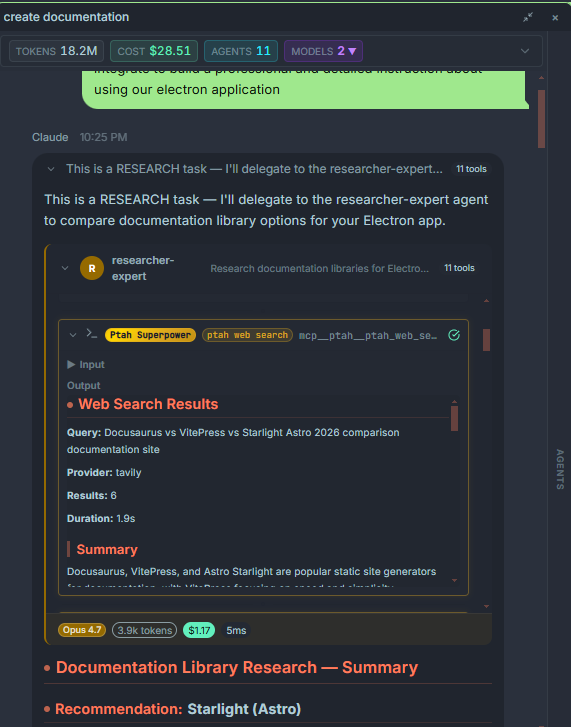
Section titled “Execution Tree”The Execution Tree is a recursive visualization of everything that happened during a single turn — every sub-agent spawn, every tool call, every thinking block. It’s the main debugging and observability surface in Ptah.
Opening the tree
Section titled “Opening the tree”The tree lives in the right-hand pane of the chat. If it’s collapsed, click the tree icon in the chat header, or click any tool call card or sub-agent chip in the transcript — the tree opens with that node selected.
What a node represents
Section titled “What a node represents”Each node is one unit of work:
| Node type | Meaning |
|---|---|
| Message | An assistant text message or a user message. |
| Thinking | A reasoning block. Click to expand and read the model’s internal chain of thought (for providers that expose it). |
| Tool call | A single tool invocation — Read, Write, Bash, Grep, MCP tool, etc. Shows inputs, outputs, and timing. |
| Sub-agent | A spawned agent (via ptah_agent_spawn or the SDK agent tool). Expands to reveal that agent’s own tree. |
| Error | A failed tool call or aborted sub-agent. |
What each node shows
Section titled “What each node shows”Hover or click to see:
- Duration (ms).
- Tokens in, tokens out, cached tokens.
- USD cost for the node.
- Model and provider used.
- Full raw inputs and outputs (JSON view toggle).
Recursive by design
Section titled “Recursive by design”Sub-agents can spawn their own sub-agents. The tree renders that hierarchy naturally — collapse any branch to focus on the parts you care about. Depth is unlimited, but Ptah warns you if a branch goes deeper than four levels (usually a sign of runaway delegation).
Exporting a tree
Section titled “Exporting a tree”From the tree header menu:
- Copy as JSON — the full tree as structured data for scripting.
- Copy as Markdown — a human-readable transcript with indentation.
- Save to file — writes
.ptah/traces/<session>-<turn>.jsonin your workspace.
These exports are what the /orchestrate agents use to hand off work between specialists.