Cost and tokens
Cost and tokens
Section titled “Cost and tokens”Every turn in Ptah is costed in real time. You see tokens in, tokens out, cache reads, and USD cost per message — and a running total for the session — without having to leave the chat.
Where costs appear
Section titled “Where costs appear”| Location | What it shows |
|---|---|
| Cost bar (chat header) | Running session totals: input tokens, output tokens, cache reads, total USD. |
| Per-message footer | Tokens and USD for that single turn, including all sub-agents spawned from it. |
| Execution Tree node | Tokens and USD for each individual sub-agent and tool call. |
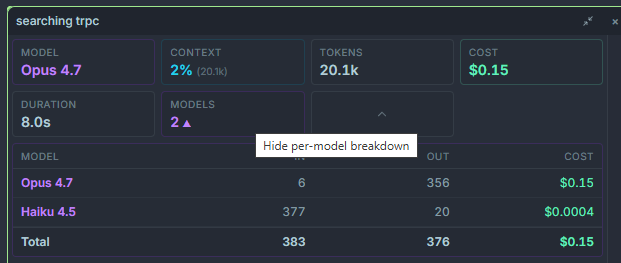
| Session summary card | End-of-session rollup with breakdowns per provider and per model. |
Where pricing comes from
Section titled “Where pricing comes from”- Claude (direct Anthropic API) — published Anthropic pricing, per model.
- OpenRouter — live pricing pulled from the OpenRouter model registry. Prices update whenever OpenRouter updates theirs, so third-party models (Gemini, GPT, Moonshot, Z-AI, etc.) are costed accurately without app updates.
- Copilot — reported as $0 because billing is handled by your Copilot subscription. Tokens are still counted.
- Codex / OpenAI direct — official OpenAI pricing per model.
- Ollama (local and cloud) — reported as $0 for local; Ollama Cloud uses their published rates.
- Ptah CLI — reported as $0 (billing is handled by whatever provider the CLI wraps).
Cache tokens
Section titled “Cache tokens”Claude and several OpenRouter-backed models support prompt caching. Cached reads are dramatically cheaper than fresh input tokens, and Ptah shows them as a separate line item:
- Cache creation — first-time tokens that get written to the cache.
- Cache read — tokens served from the cache (≈ 10% of the fresh price on Anthropic).
Seeing a high cache-read count is a good sign: it means Ptah is reusing context across turns.
Per-session rollup
Section titled “Per-session rollup”When you close a chat (or click Session summary in the chat header), you get a breakdown:
- Total USD, grouped by provider and model.
- Tokens in, tokens out, and cached tokens.
- Sub-agent spawn count and total sub-agent cost.
- Longest running tool call and slowest turn.
This is the same data exported to the usage logs for license reporting if you have a Pro subscription.